I am currently designing my RStudio - Dropbox - Mardown/Knitter/Wordpress - Github workflow. One problem is that working on multiple machines with different version of Windows means I somehow need to tell R where my Dropbox folder is located.
I used to set the working directory at the beginning of my R scripts but it became tedious to change the path all the time. The solution might be to add definition of 'dropbox.folder.path' variable to .Rprofile files. Or there is a hard way - to write a script detecting Dropbox location automatically.
Wednesday, August 8, 2012
Tuesday, May 29, 2012
Mystery of mysteries
And now for something completely different to Facebook mining. Our paper "DISSECTING THE GENETIC ARCHITECTURE OF F1 HYBRID STERILITY IN HOUSE MICE" has just appeared at Evolution Journal. Let me give a brief explanation - and keep in mind that my major is math, not genetics.
From statistical point of view it is just an application of Karl Broman's R/qtl package. From biological point of view it is "mystery of mysteries", the term used by Darwin to refer to the mechanism by which two groups of animals become genetically incompatible.
A house mouse is a nice model of that phenomenon because its subspecies diverged relatively recently and you can still force them to breed if you want to. However, as described in the paper, male offspring of certain combination of parents are then unable to reproduce. Our long-term goal is to describe what is behind this sterility.
Two "ingredients" are already known: Prdm9 gene on Chr17 and "something" hidden in 4.5Mb region on ChrX. If any these two are not present in the required combination of alleles, then the mouse is fertile (or at least has normal testes weight and sperm count). However, as we know, Chr17 and ChrX are not the full story. There is some "secret ingredient(s)" needed to reach the full sterility and we have been unsuccessful in mapping it. Maybe there are just too many genes involved, i.e. our tests are underpowered.
The second possible explanation (submitted to CTC Meeting in Paris) is that the "secret ingredient(s)" might not to be a gene or anything you can assign to specific genomic location. Prdm9 (Chr17) is famous for playing role in a genetic recombination, shuffling of genetic information during sperm/eggs production. And recently, we verified that 4.5Mb ChrX region is also taking part in this process. Specifically, Prdm9 determines the location of recombination events and ChrX region influences the recombination frequency. So, is the "secret ingredient" mobile elements, repetitive sequences, heterochromatin or Bigfoot? One day we hope to know.
Selected papers:
- Prdm9 as the speciation (=sterility) gene - Mihola et al.: A Mouse Speciation Gene Encodes a Meiotic Histone H3 Methyltransferase, Science (2008).
- Prdm9 and its role in recombination - Baudat et al.: PRDM9 Is a Major Determinant of Meiotic Recombination Hotspots in Humans and Mice, Science (2010).
- Sterility QTL on ChrX - Storchova et al.: Genetic analysis of X-linked hybrid sterility in the house mouse, Mammalian Genome (2004).
- Major recombination QTL on ChrX - Dumont and Payseur: Genetic Analysis of Genome-Scale Recombination Rate Evolution in House Mice, PLOS Genetics (2012).
Wednesday, January 18, 2012
Mining Facebook Data: Most "Liked" Status and Friendship Network
UPDATE 05/2014: The text is now obsolete. Use Rfacebook package instead, see examples here and there.
Professional R Enthusiast published a quick manual how to use Facebook Graph API. I particularly like a trick to obtain an access-token using Graph API Explorer.
Now, you can easily employ R to get your most "Liked" Facebook status ever. For me it was this photo followed by a lot of posts about my kids. The same code can be applied to Facebook Group or Page. For example the most popular videos, that appeared on TED Page last year, were the following:
- Remembering Steve Jobs
- Graham Hill: Less stuff, more happiness
- Simon Sinek: How great leaders inspire action
Now let us try something more sophisticated. Before Xmas a lot of my friends tested MyFnetwork app to visualize their friendship networks (see my network below). Surely, this is not the first app doing this. However, this might be the first one really useful. I can see groups of my friends separated (colleagues vs. friends of my wife vs. high school classmates vs. university classmates). Highlighting tries to emphasize the key persons in each group but unfortunately it misses an adjustment for total number of friends (Facebook enthusiasts like PetrC or LenkaZ seem to be more special than they really are).
 |
| Original myFnetwork graph |
So how difficult would it be to produce a similar graph with R? Actually, as you can see it is just a few lines of code. First I scraped the list of friends, then for each of them I got the list of mutual friends and finally Rgraphviz package does the plotting stuff.
 |
| R/Graphviz plot with initials |
As you can see the graphs are pretty similar (most likely, MyFnetwork also uses some port of Graphviz code). Of course, there exists endless list of modifications. For example, you can first download friends' profile pictures and then use custom node plotting function to produce something like the following:
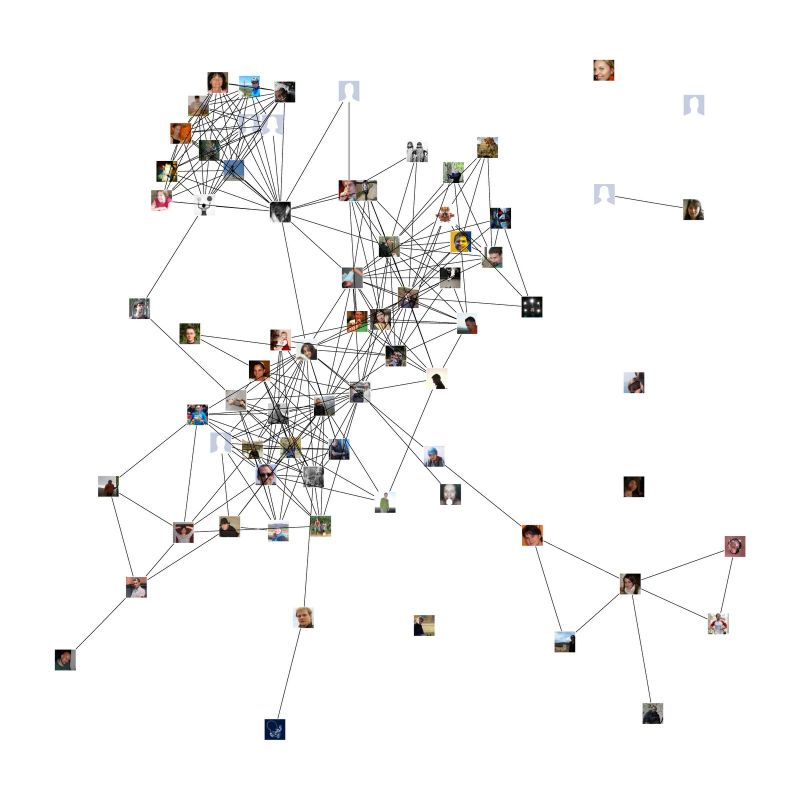 |
| R/Graphviz plot with profile pictures |
Romain Francois: Crawling facebook with R
Update: I am getting comments about your installation problems with RCurl and Rgraphviz packages. Honestly, I am not administrator of my Ubuntu Linux Server and I have only a limited knowledge about possible issues. RCurl seems to be ok even on my Win32 machine - read the FAQ. Rgraphviz is a bit more tricky: see How to install it under Windows but I would recommend you a decent linux distribution for this work.
Wednesday, January 11, 2012
Toying with Google Apps Script
Google offers an access to its services with Apps Scripts (JavaScript). That gives you a possibility to connect your spreadsheet to a fascinating variety of tools like geocoder, stock info, language translator, or email.
My java-scripting abilities are rather limited but just playing with tutorial examples I was quickly able to produce a script analyzing time distribution of received emails. It looks through your Gmail for the given contact and record the times of emails sent by it.
So this is email behaviour of my wife. You can see a peak at the noon when babies are having a nap and another local maximum at the end of the day when they are finally sleeping in beds.

Subscribe to:
Posts (Atom)