Wednesday, January 18, 2012

Mining Facebook Data: Most "Liked" Status and Friendship Network


UPDATE 05/2014: The text is now obsolete. Use Rfacebook package instead, see examples here and there.

Professional R Enthusiast published a quick manual how to use Facebook Graph API. I particularly like a trick to obtain an access-token using Graph API Explorer.

Now, you can easily employ R to get your most "Liked" Facebook status ever. For me it was this photo followed by a lot of posts about my kids. The same code can be applied to Facebook Group or Page. For example the most popular videos, that appeared on TED Page last year, were the following:
See the code, it is not so long.

Now let us try something more sophisticated. Before Xmas a lot of my friends tested MyFnetwork app to visualize their friendship networks (see my network below). Surely, this is not the first app doing this. However, this might be the first one really useful. I can see groups of my friends separated (colleagues vs. friends of my wife vs. high school classmates vs. university classmates). Highlighting tries to emphasize the key persons in each group but unfortunately it misses an adjustment for total number of friends (Facebook enthusiasts like PetrC or LenkaZ seem to be more special than they really are). 

Original myFnetwork graph

So how difficult would it be to produce a similar graph with R? Actually, as you can see it is just a few lines of code. First I scraped the list of friends, then for each of them I got the list of mutual friends and finally Rgraphviz package does the plotting stuff. 

R/Graphviz plot with initials


As you can see the graphs are pretty similar (most likely, MyFnetwork also uses some port of Graphviz code). Of course, there exists endless list of modifications. For example, you can first download friends' profile pictures and then use custom node plotting function to produce something like the following:
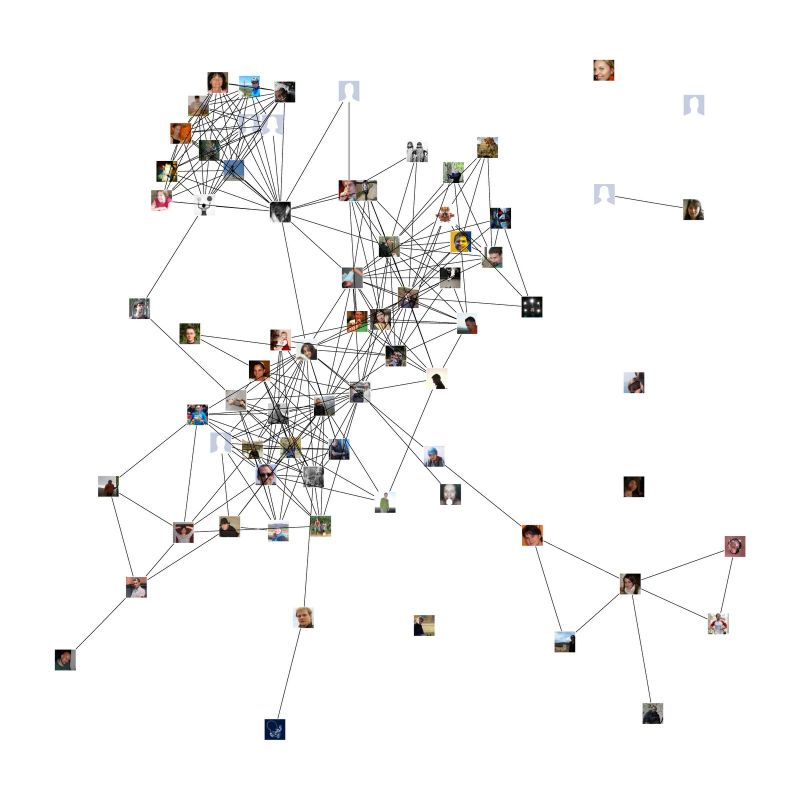
R/Graphviz plot with profile pictures
Now you can guess who is my wife and who is the problematic friend from the previous post :-) Anyway, myFnetwork claims to get over 1.3 million users in 6 weeks. How difficult could it be make R Facebook/app?


Romain Francois: Crawling facebook with R

Update: I am getting comments about your installation problems with RCurl and Rgraphviz packages. Honestly, I am not administrator of my Ubuntu Linux Server and I have only a limited knowledge about possible issues. RCurl seems to be ok even on my Win32 machine - read the FAQ. Rgraphviz is a bit more tricky: see How to install it under Windows but I would recommend you a decent linux distribution for this work.

Wednesday, January 11, 2012

Toying with Google Apps Script

Google offers an access to its services with Apps Scripts (JavaScript). That gives you a possibility to connect your spreadsheet to a fascinating variety of tools like geocoder, stock info, language translator, or email.

My java-scripting abilities are rather limited but just playing with tutorial examples I was quickly able to produce a script analyzing time distribution of received emails. It looks through your Gmail for the given contact and record the times of emails sent by it.

So this is email behaviour of my wife. You can see a peak at the noon when babies are having a nap and another local maximum at the end of the day when they are finally sleeping in beds.

Wednesday, December 7, 2011

UseR! 2011 slides are now available

I have just realized that UseR! 2011 presentation slides are now available from the conference web site.

Unfortunately, no big surprise this year. Or maybe this is good news as it means that I have all the important stuff in my RSS Reader. And by the way, this blog is now listed on www.r-bloggers.com.

To be fair there was a couple of interesting talks (reaching my attention before the slides were published), namely

Paul Marrel: Vector Image Processing
Paul is converting static PDF image into dynamic SVG graphics. This is not so much about R but it is really cool.

Markus Gesmann: Using the Google Visualisation API with R
Easy way how to put dynamic images on your web page. Particularly useful, if you work with GPS tracking data. Verified :-)

Susan Ranney: It's a Boy! An Analysis of Tens of Millions of Birth Records Using R
RevoScaleR functionality demonstrated on 3.1GB dataset of birth records.

Ulrike Grömping: Design of Experiments in R
This is a bit personal. I have very little (read "no") experience with designing experiments (DoE). Back in 2008 I met my wife's supervisor that was an author of an old commercial DoE software. We both realized that R missed a lot of DoE methods. The problem was my lack of theoretical knowledge in this area and his style of work. I gave up but I am happy that they finally finished the job without me - the book was published and the package is available on CRAN. Looking into DoE CRAN Task View - we were not alone.

Wednesday, November 23, 2011

Prague Half Marathon Ranking: 2% or 25% missing?


I am a regular participant of Prague International Half Marathon. In a mass event like this the horde of runners needs a long time to reach the starting line. To make the times mutually comparable the “start time” is measured and afterwards subtracted from the “finish time”. Also the crowd is organized to corridors in such a way that faster runners are ahead of the slower ones.

Sometimes everything goes wrong and that was the case of the year 2010. Imagine yourself to train for months then make your best – just to discover that your time of start was not recorded. Organizers apologized but claimed that only less than 2% of the participants were affected. Really?

Wednesday, October 26, 2011

How to display R code on a web page

Starting to write a blog I need a way how to publish my R codes. One possibility would be to just add some formatting with Pretty R. Nice, but I miss a repository with all codes ever submitted and possibility to make corrections.

The final solution was to create an account on Github and submitting codes via Gist. The only problem was you cannot see the code in the Google Reader. I believe I can live with it.

Getting Genetics Done: Syntax Highlighting R Code, Revisited

Tuesday, October 25, 2011